This guide provides a comprehensive walkthrough for accessing and utilizing Built Insights Portfolio Analytics Dashboards, making it essential for users looking to enhance their data analysis skills. It covers everything from navigating the interface to applying filters and maximizing dashboard views, ensuring users can effectively tailor their analytics experience. By following this guide, users can unlock the full potential of their dashboards, leading to more informed decision-making and streamlined project management.
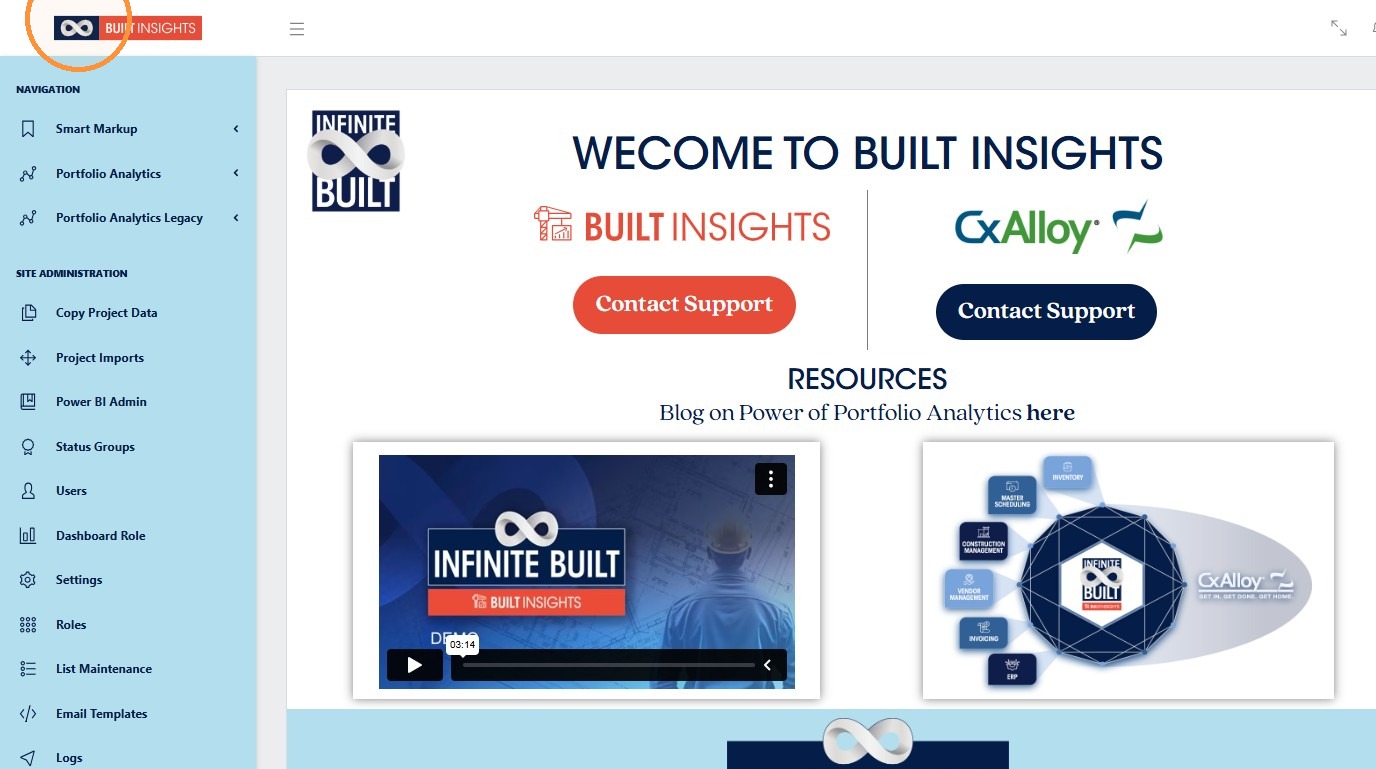
1. Navigate to the Built Insights home page.
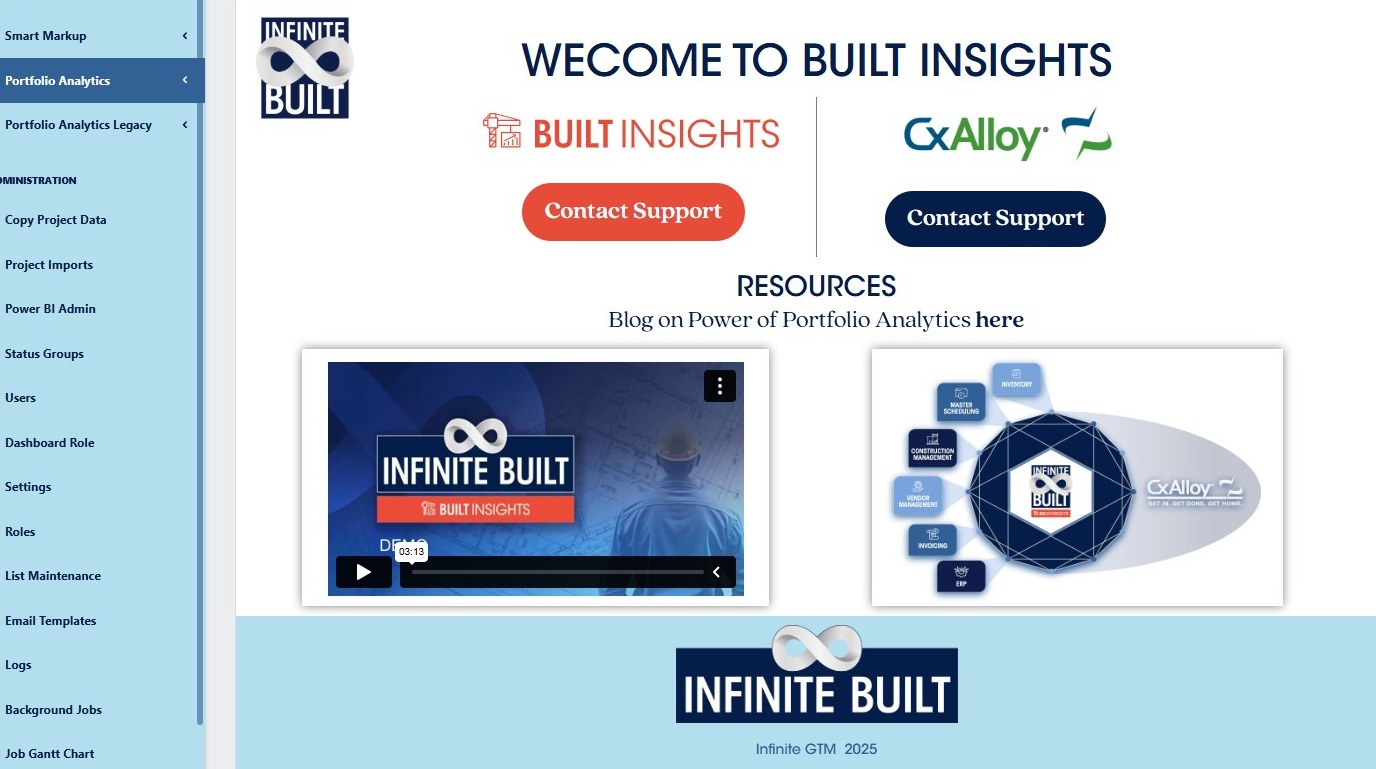
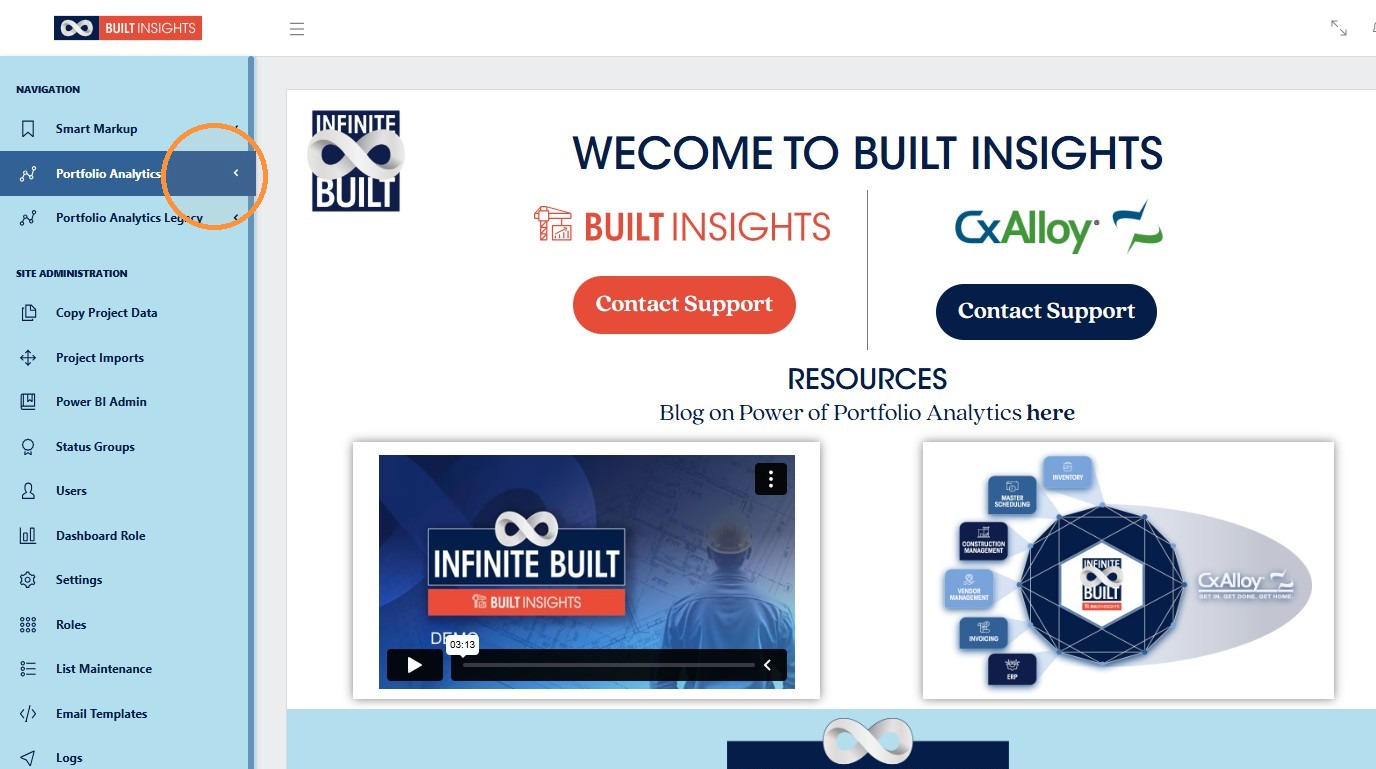
2. Click "Portfolio Analytics"
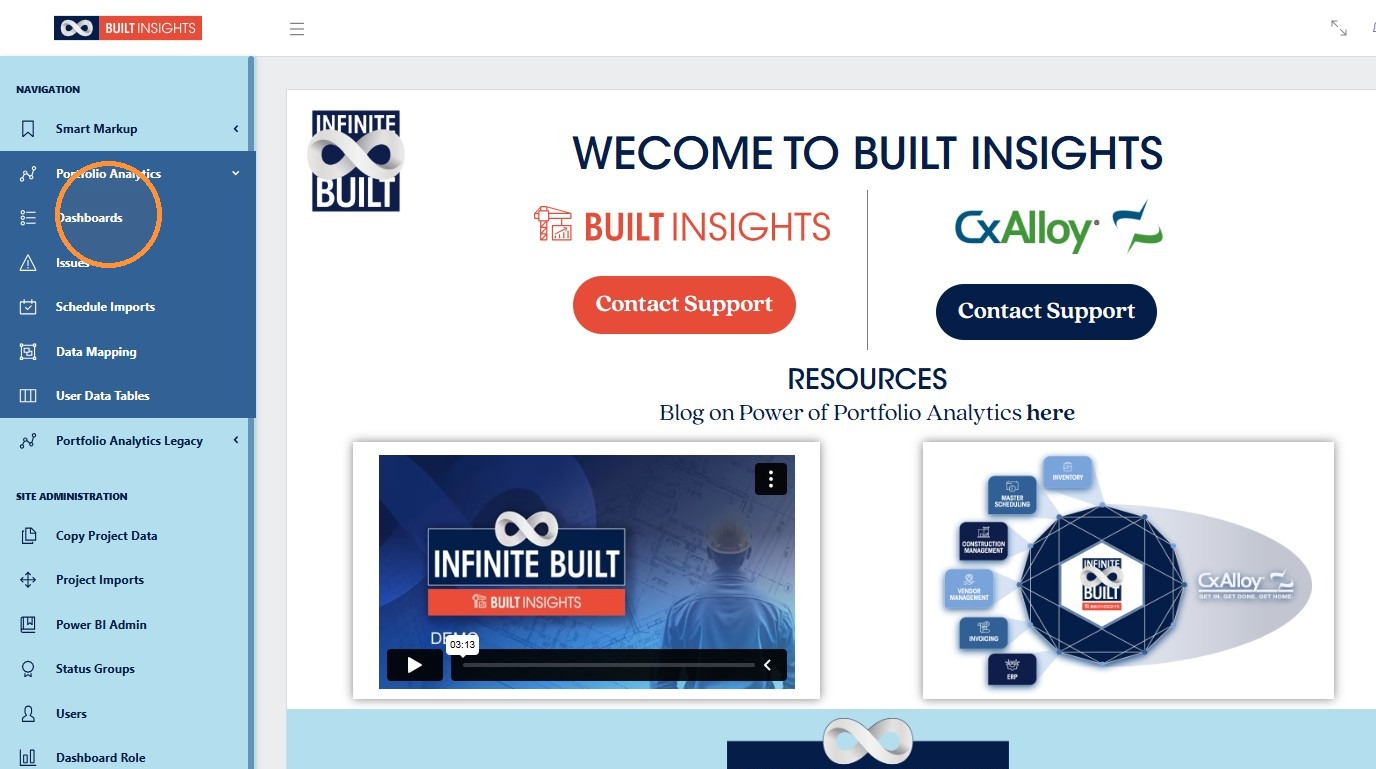
3. Click "Dashboards"
Selecting Dashboards
4. All Standard and Custom dashboards can be accessed through the Folder Icon on the Right Hand panel
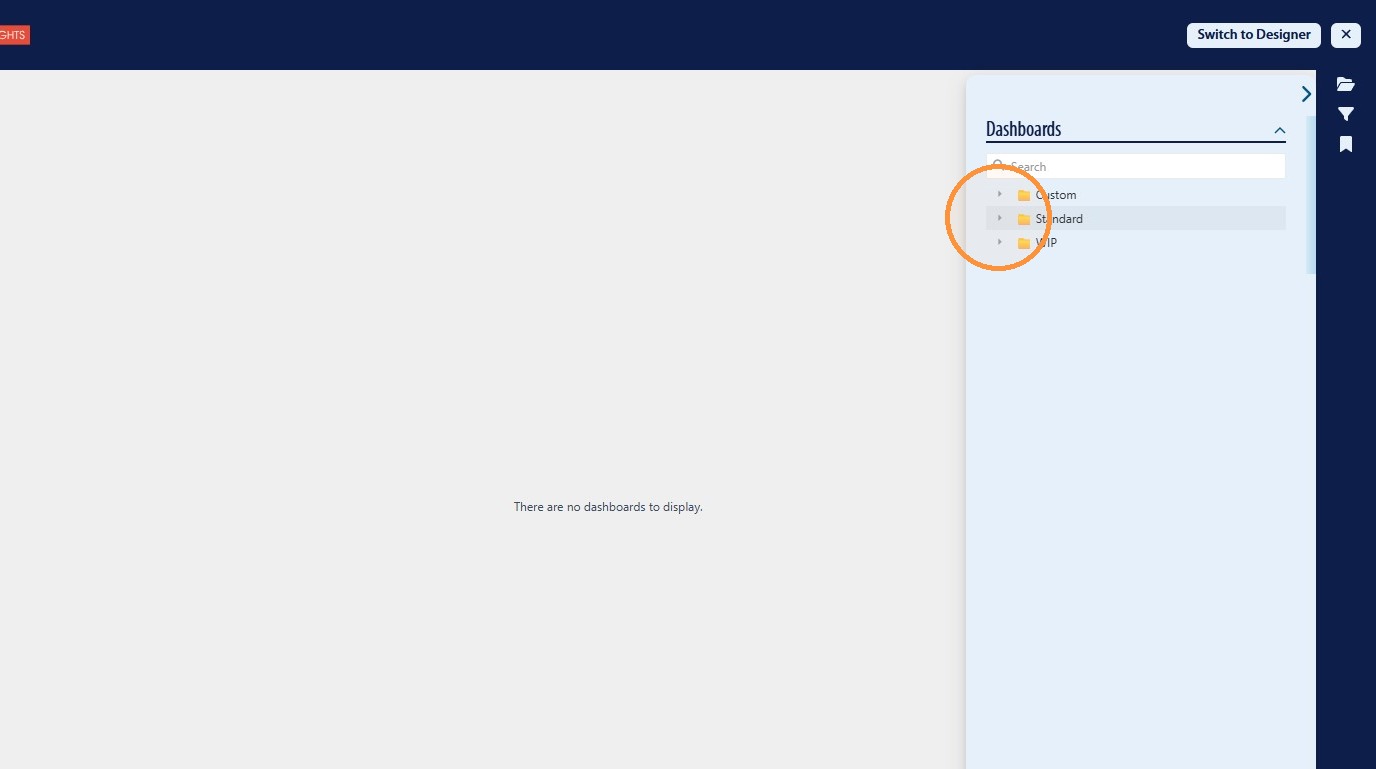
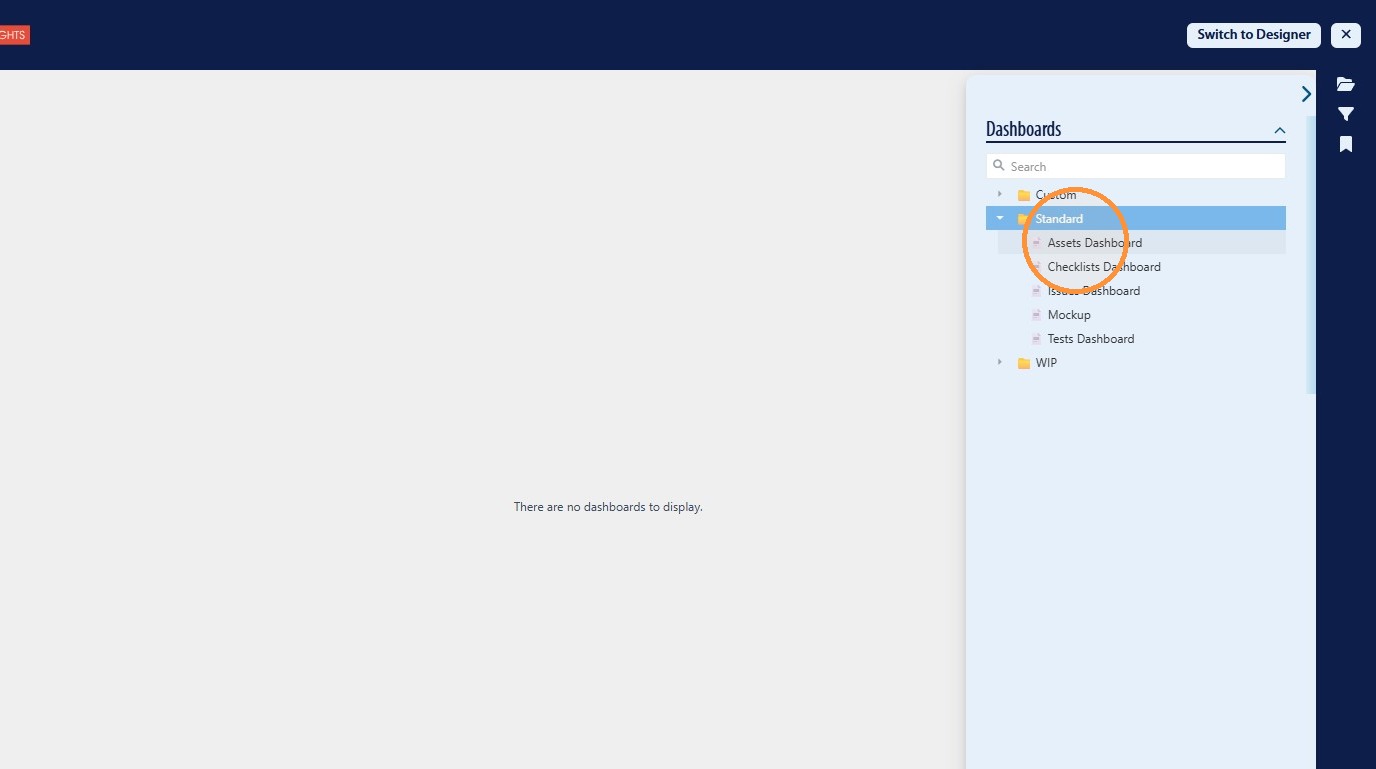
5. Utilizing the standard dashboards the user can then select the required dashboard. From here we will click "Assets Dashboard"
Filtering Dashboard Data
6. To apply filters to the dashboards the user has access through the filter icon on the Right Hand panel
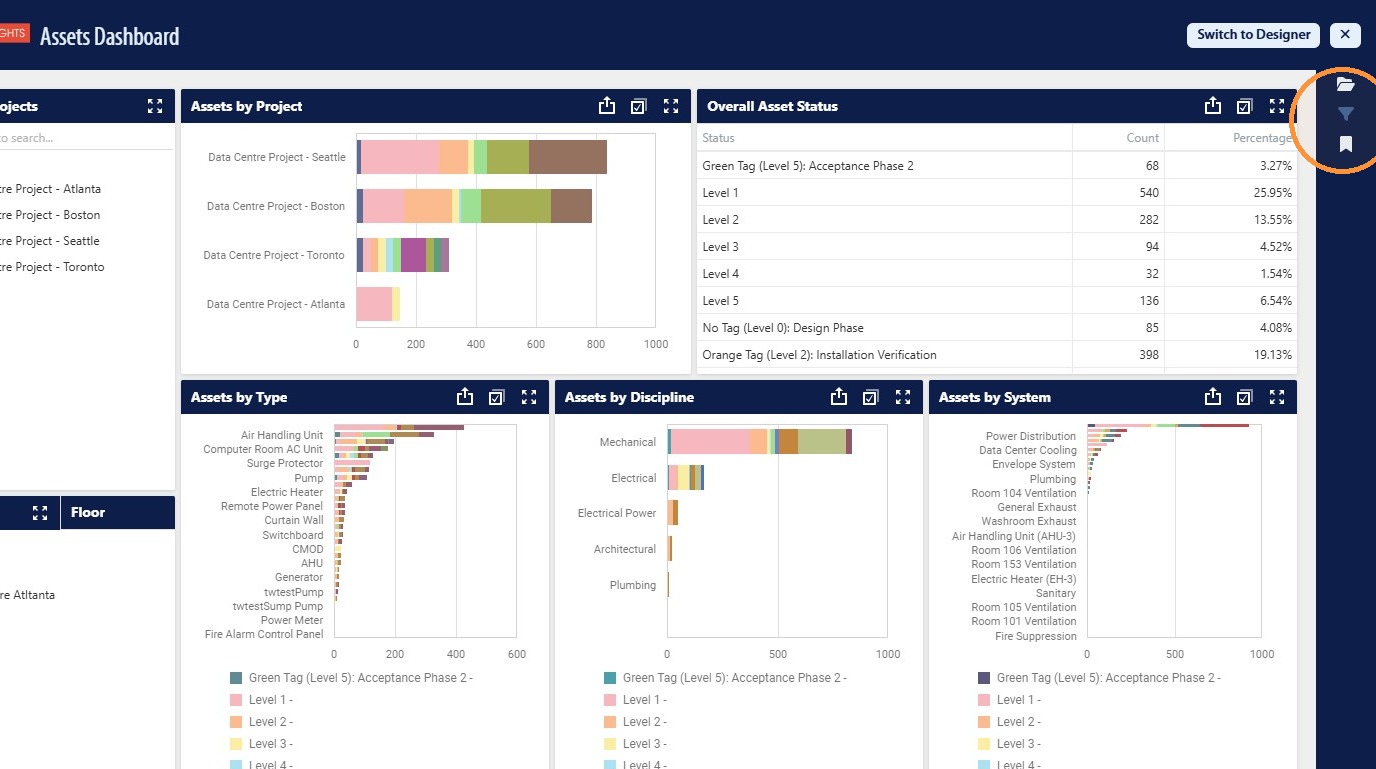
7. Once open the user will be presented with the available filter for that dashboard. This will change depending on the information included on that specific dashboard
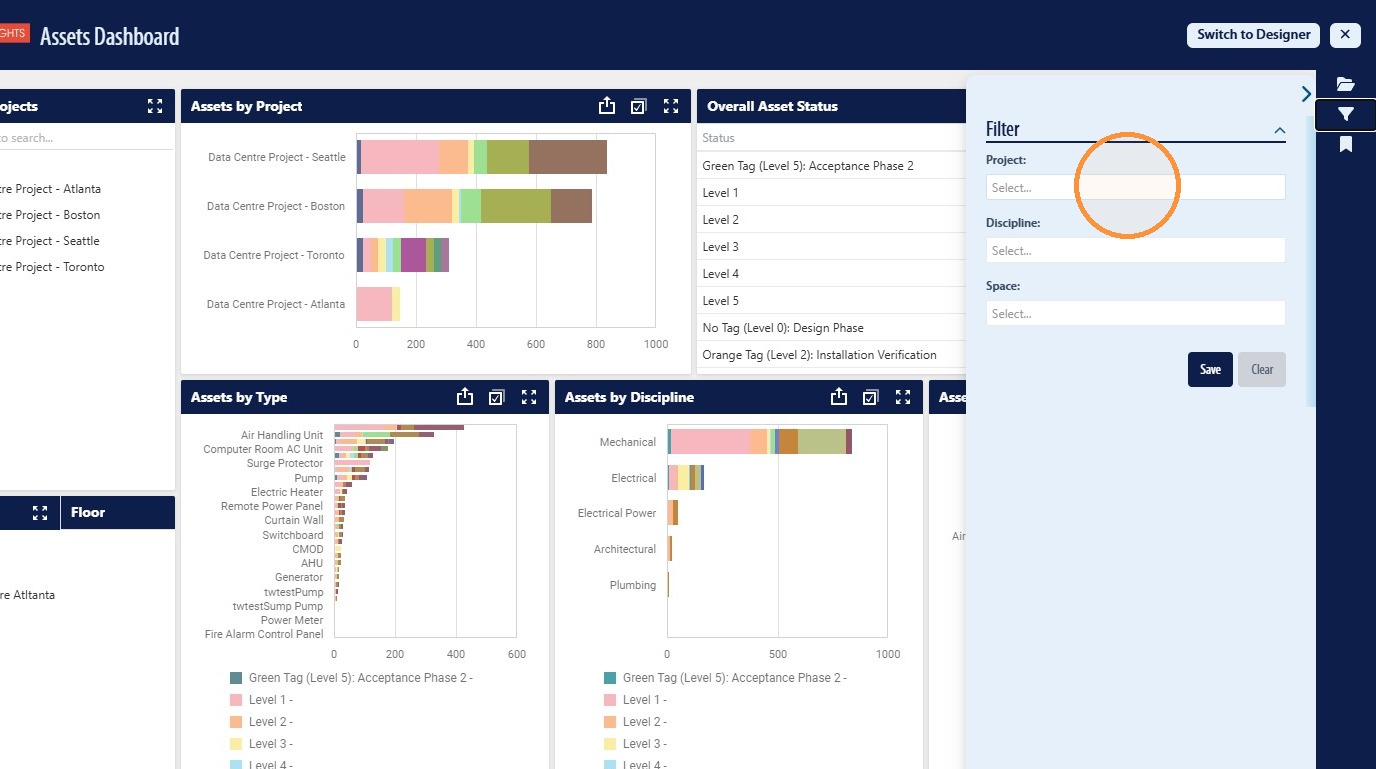
8. The user can then select the option for how they would like to filter the data on the dashboard from the avilable options
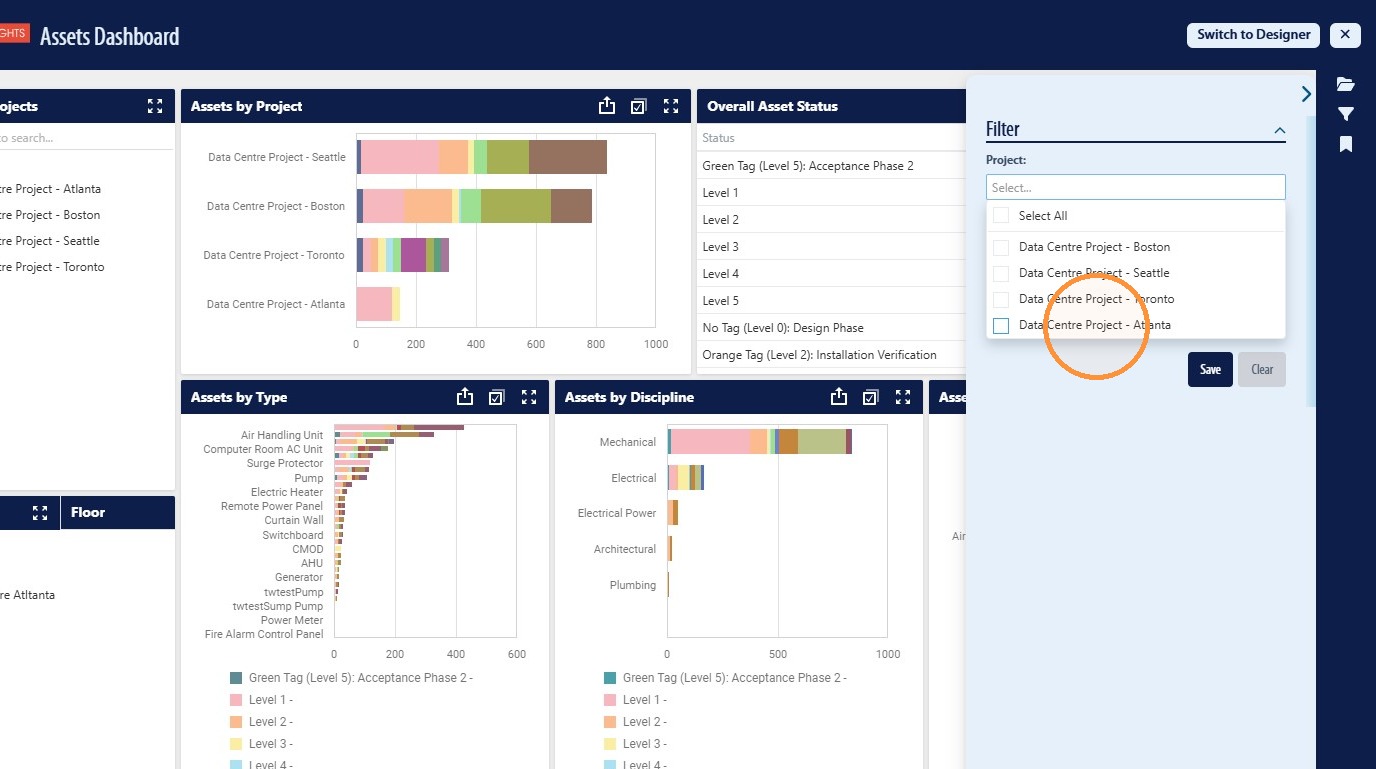
9. Once the required options have been included the user will then click "Save"
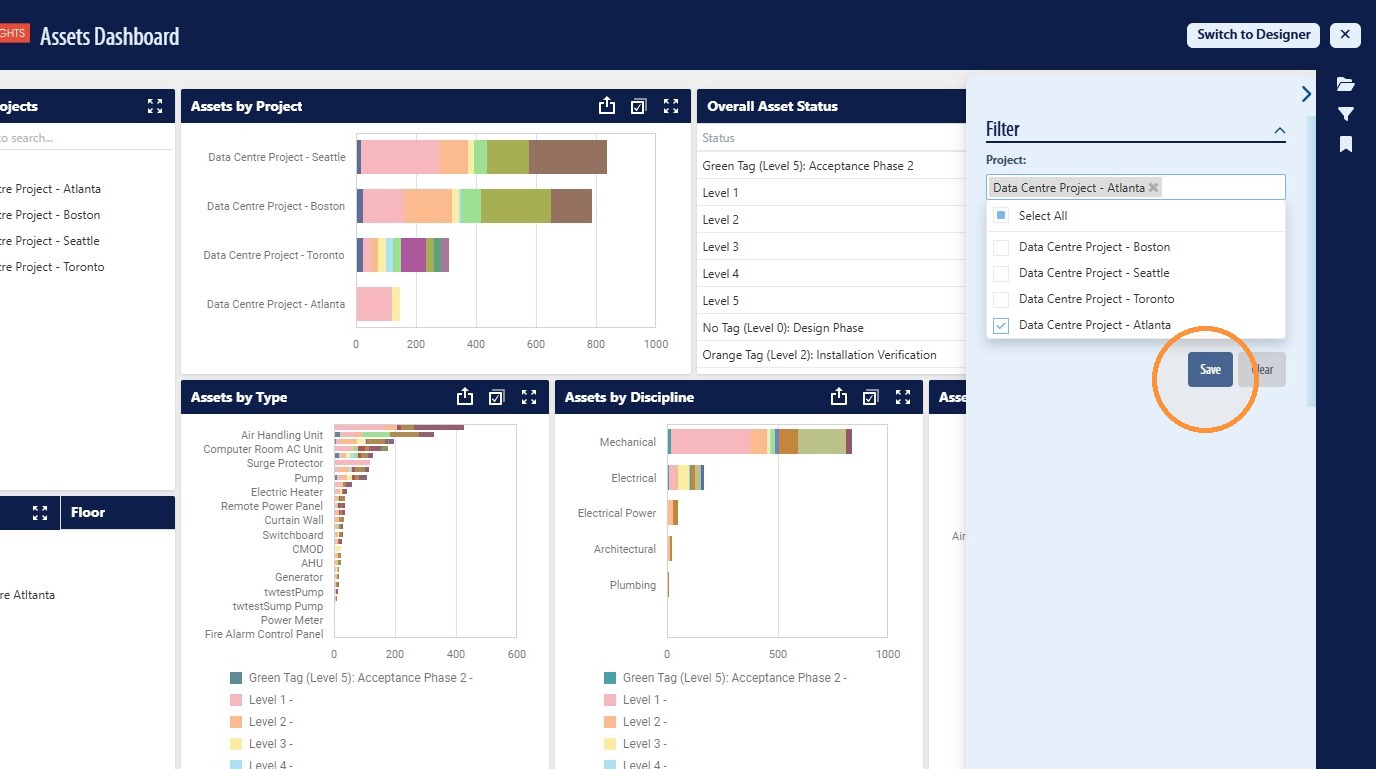
10. Once the dashboard filters have been saved the user should then collape the filter panel to expose the entire dashboard
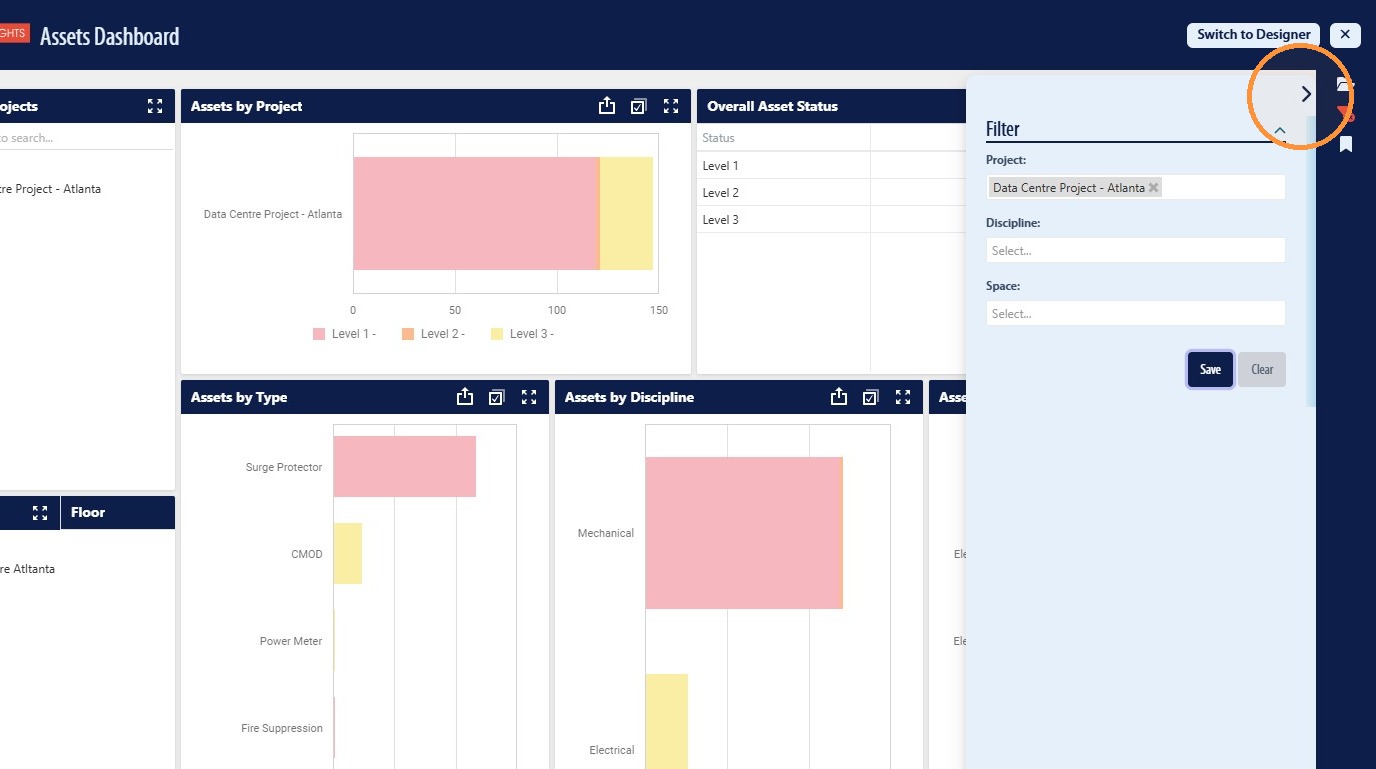
Dashboard Sub-Set Cross Filtering
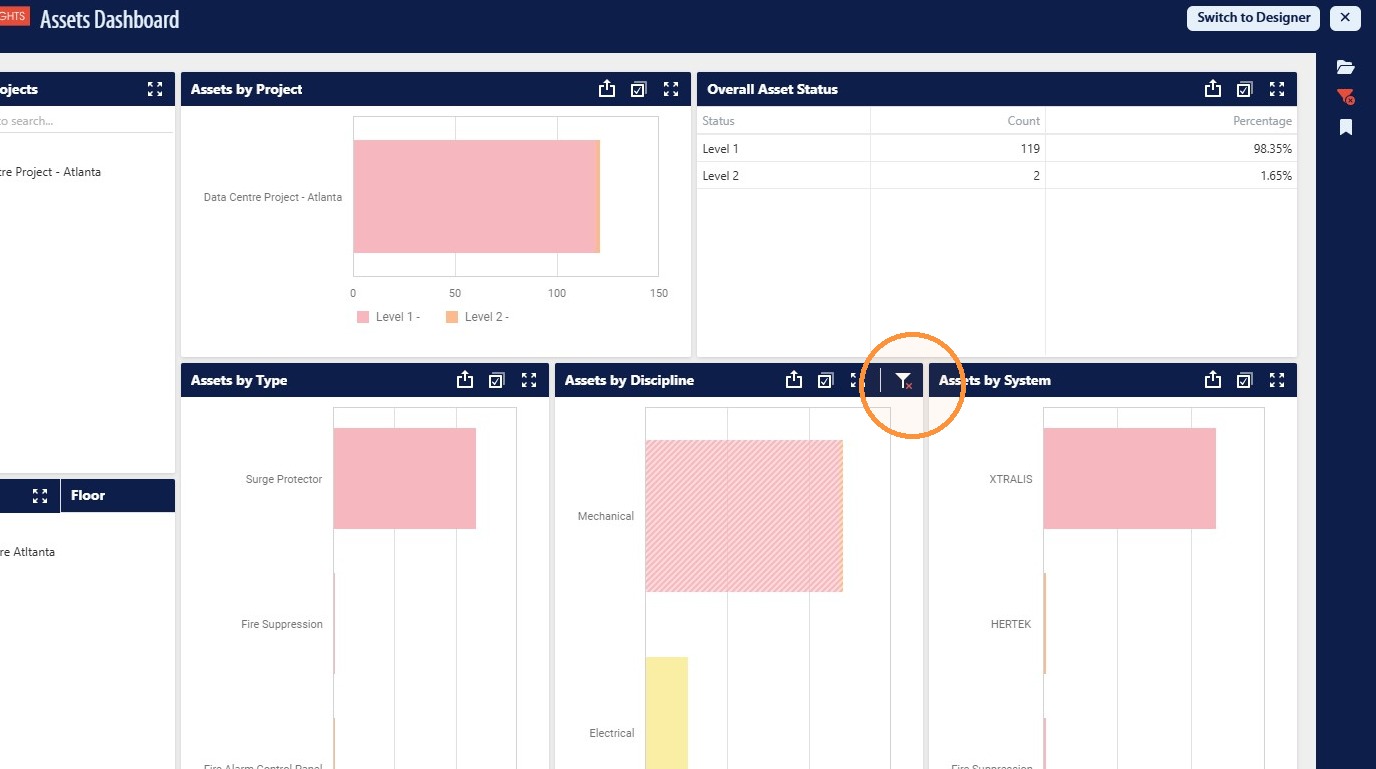
11. On Dashboard filtering is also available to users. This can be done by clicking a specific sub-set of data. The dashboard will then cross filter the data based on the user selected sub-set of data
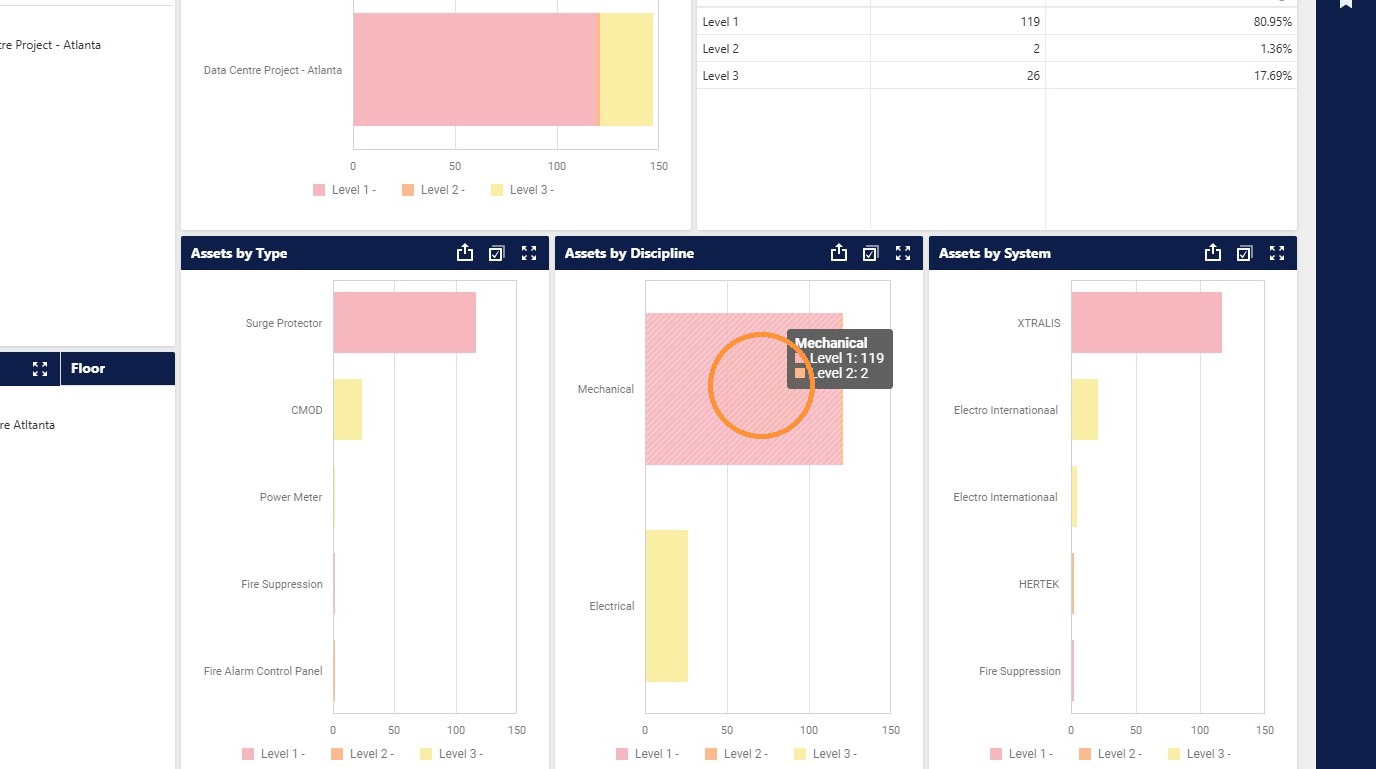
12. To remove a sub-set of data filter the user can do this by clicking "Clear Master Filter" icon
Displaying Multiple Projects on a Single Dashboard
13. Additional projects can be displayed on a single dashboard by utilizing the dashboard filter on the Right Hand panel
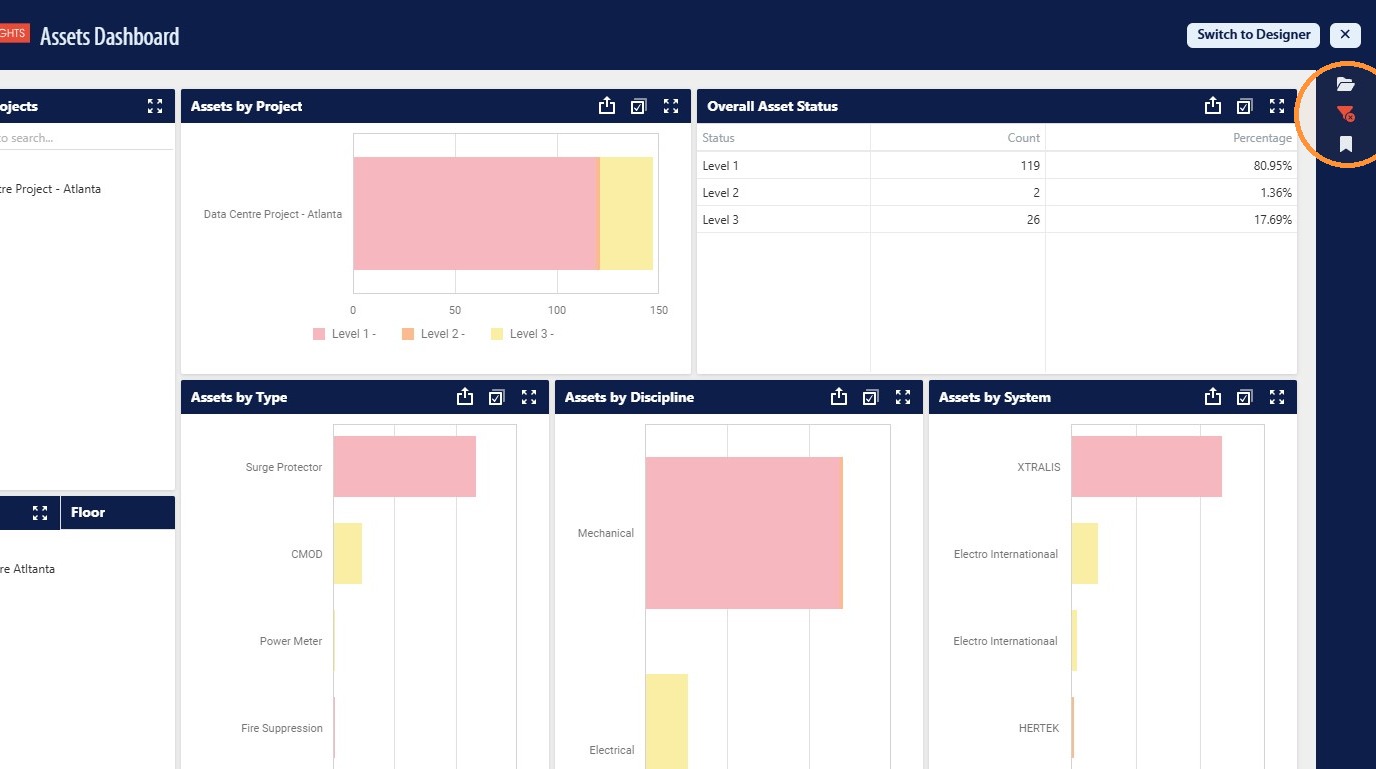
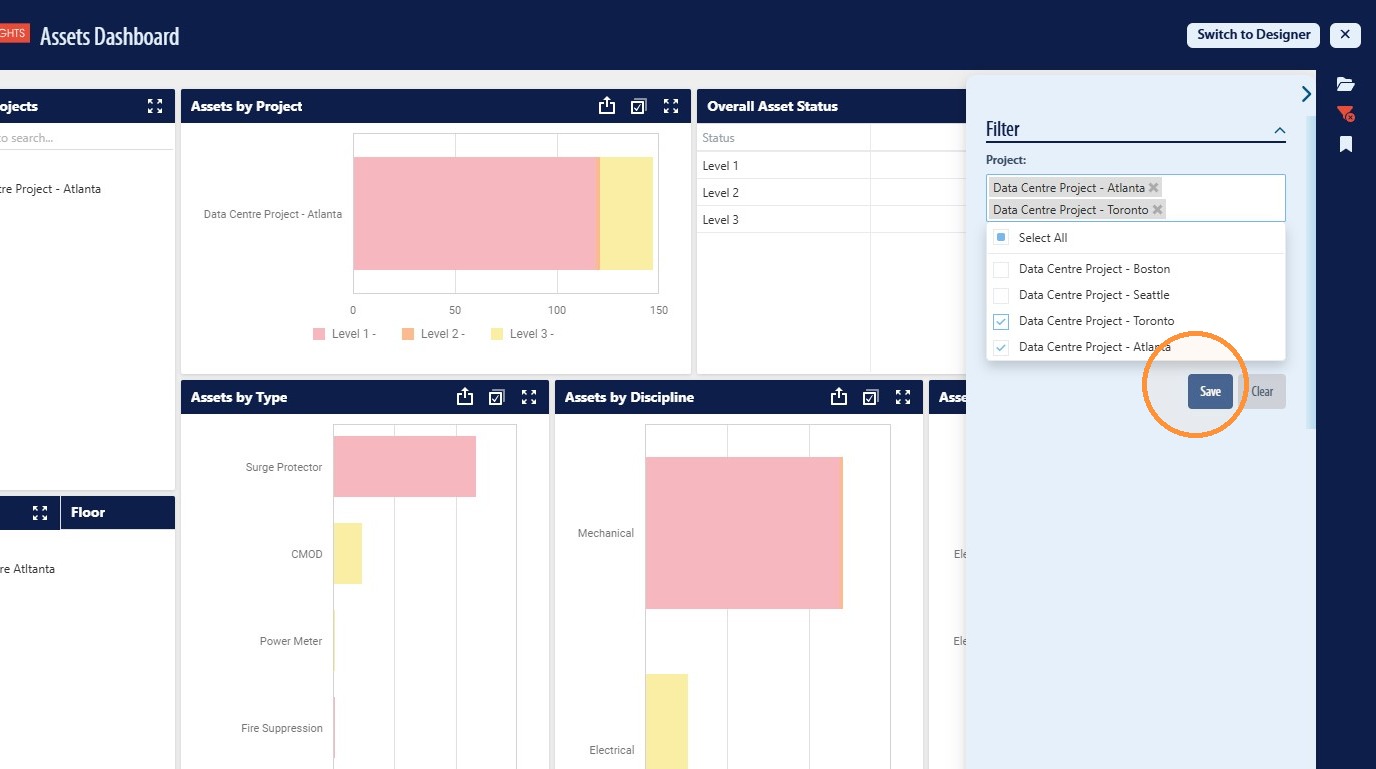
14. Once the filter panel is displayed the user can click into the empty space on the filter to display the available options
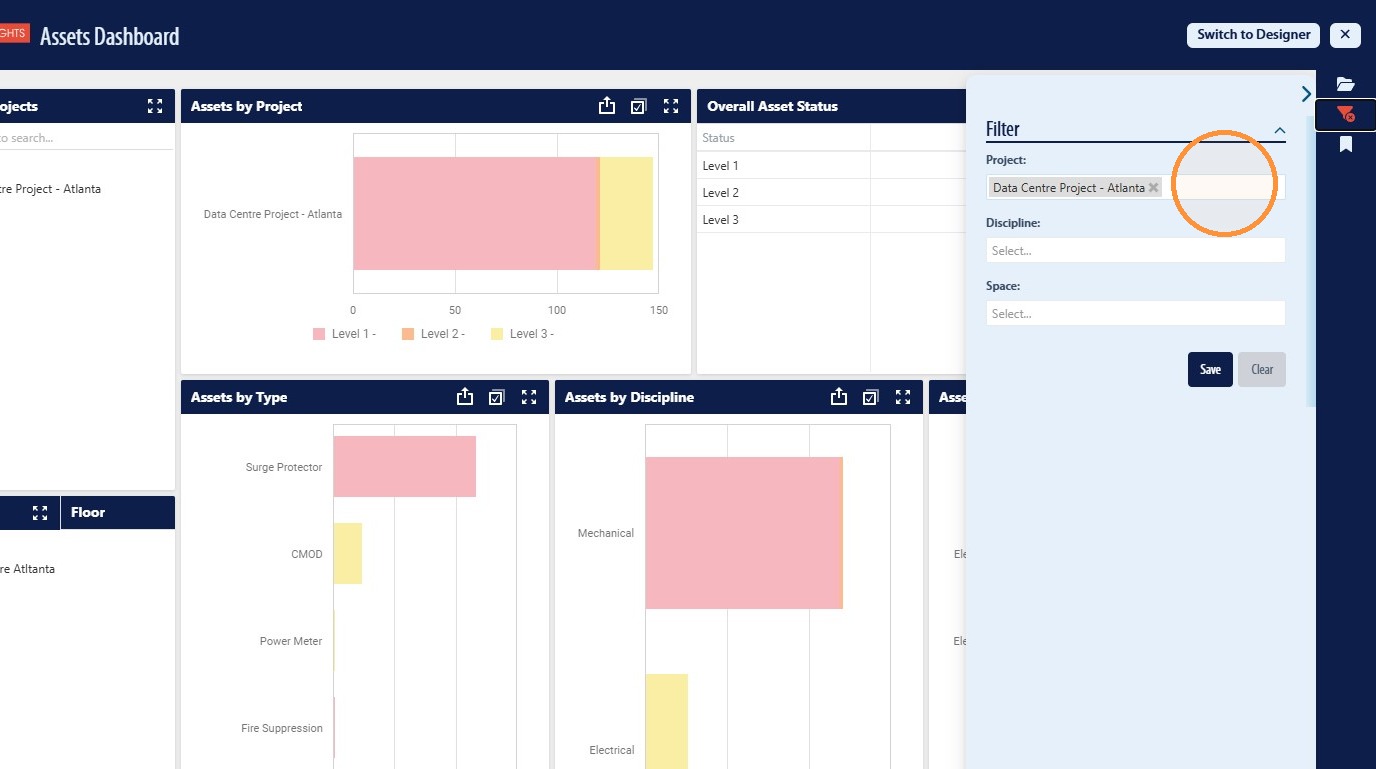
15. From here the user can select additonal project data to be displayed on the dashboard
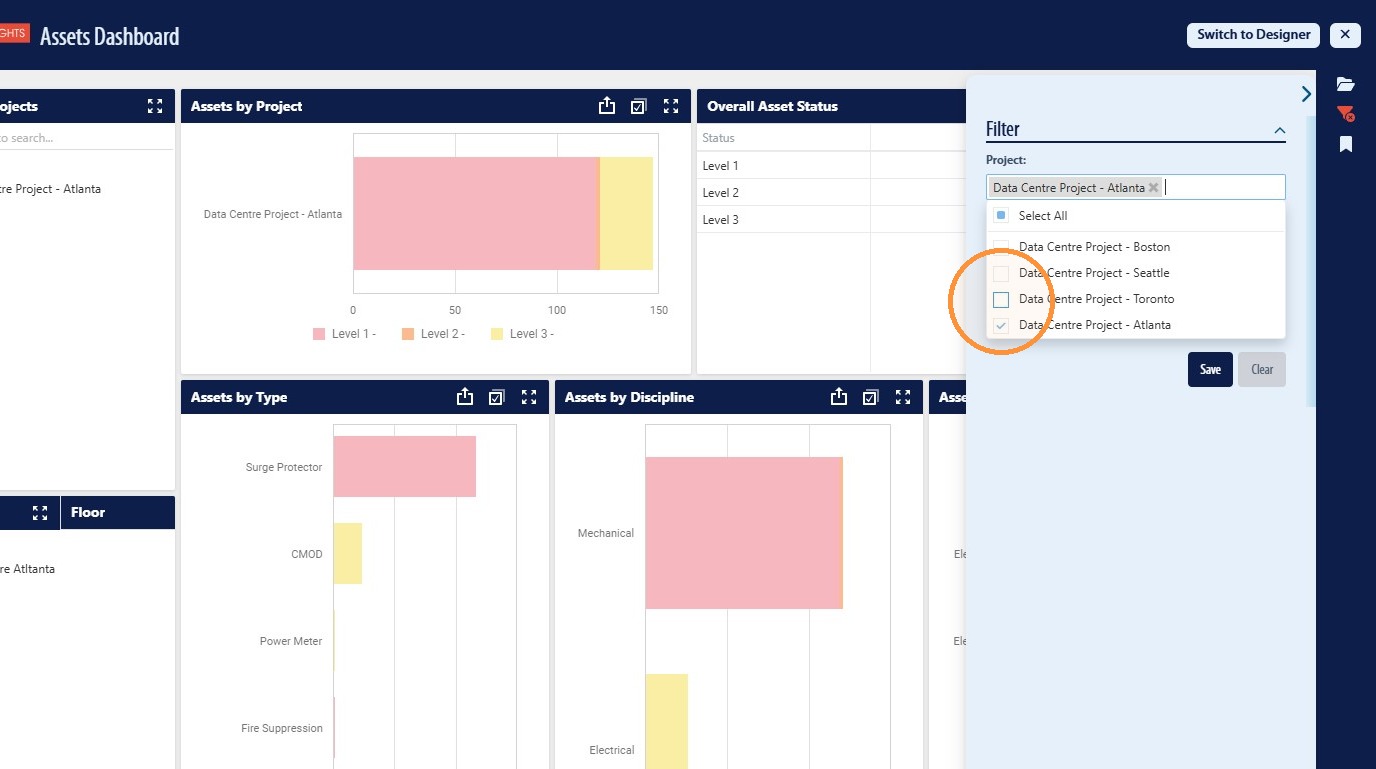
16. Once the required options have been included the user will then click "Save"
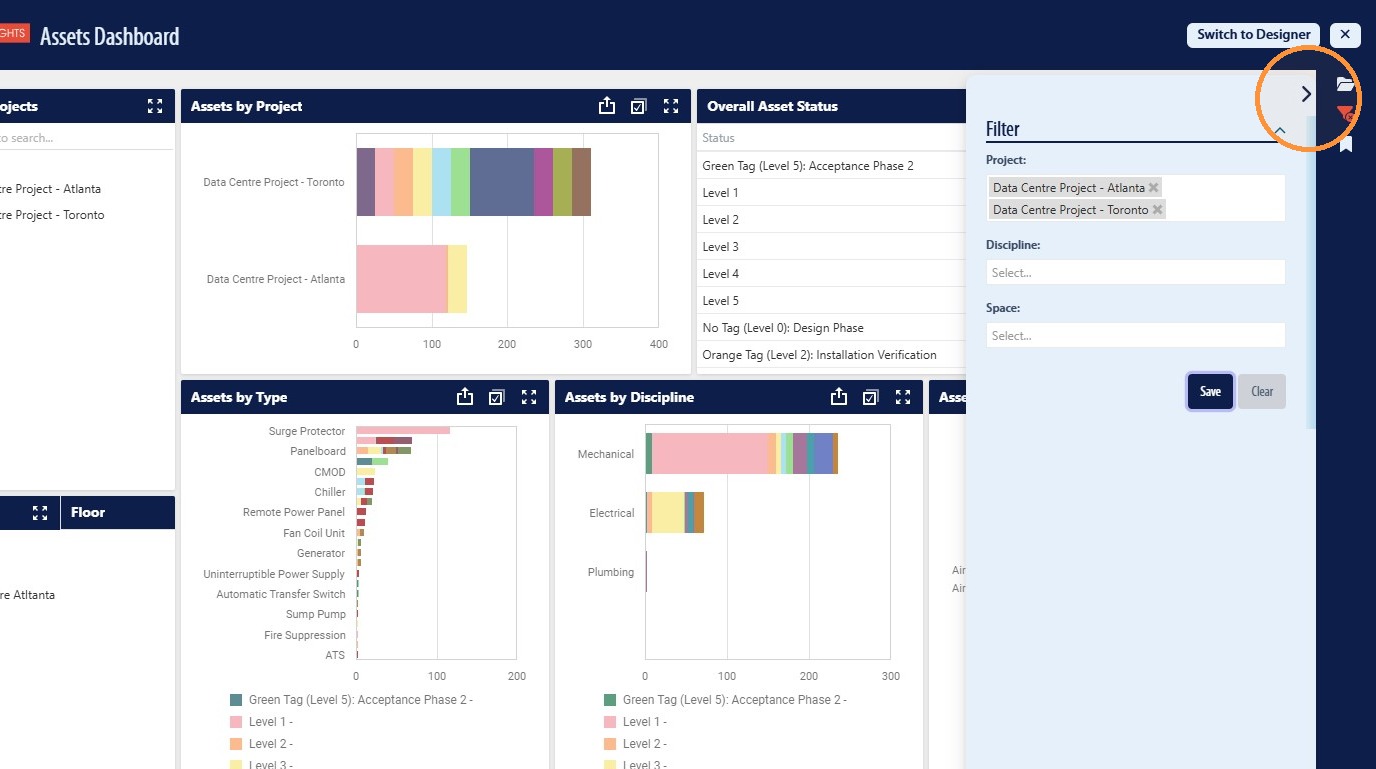
17. Once the dashboard filters have been saved the user should then collape the filter panel to expose the entire dashboard
Maximize Sub-Section of Dashboard
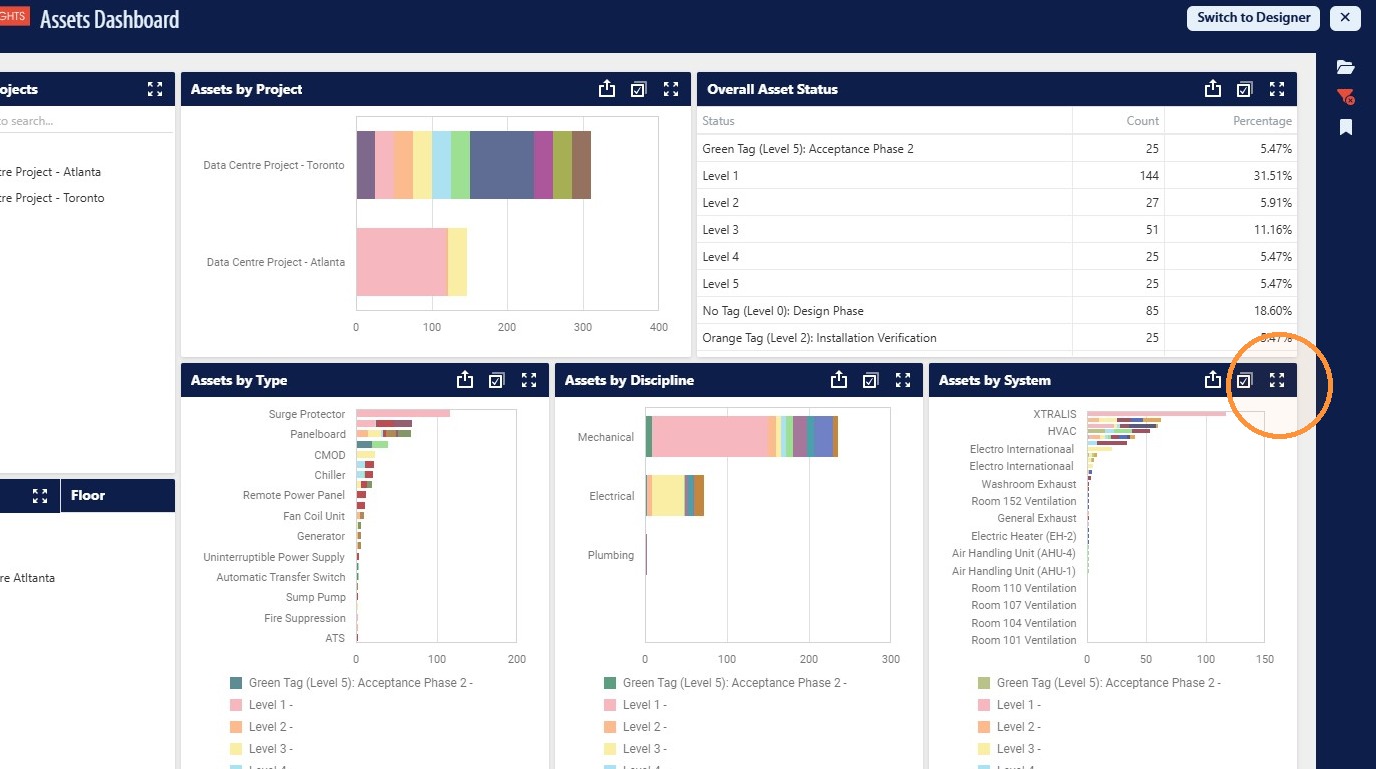
18. To expand a specific section of any dashboard the user can complete this by clicking "Maximize" which will then display that dashboard as the entire screen
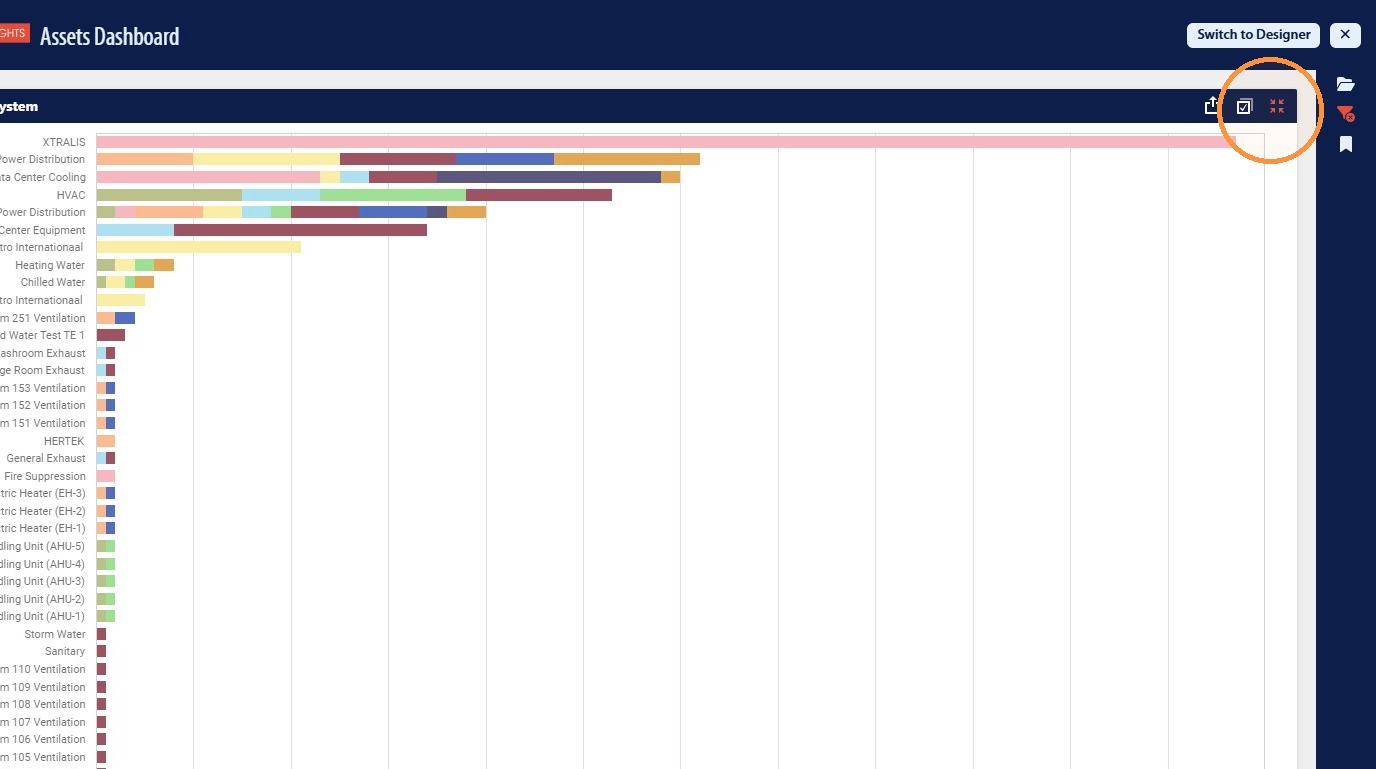
19. To return to the original dashboard view the user must select the "Maximize" icon again which set the dashboard back to the original view
Clear Dashboard Filters
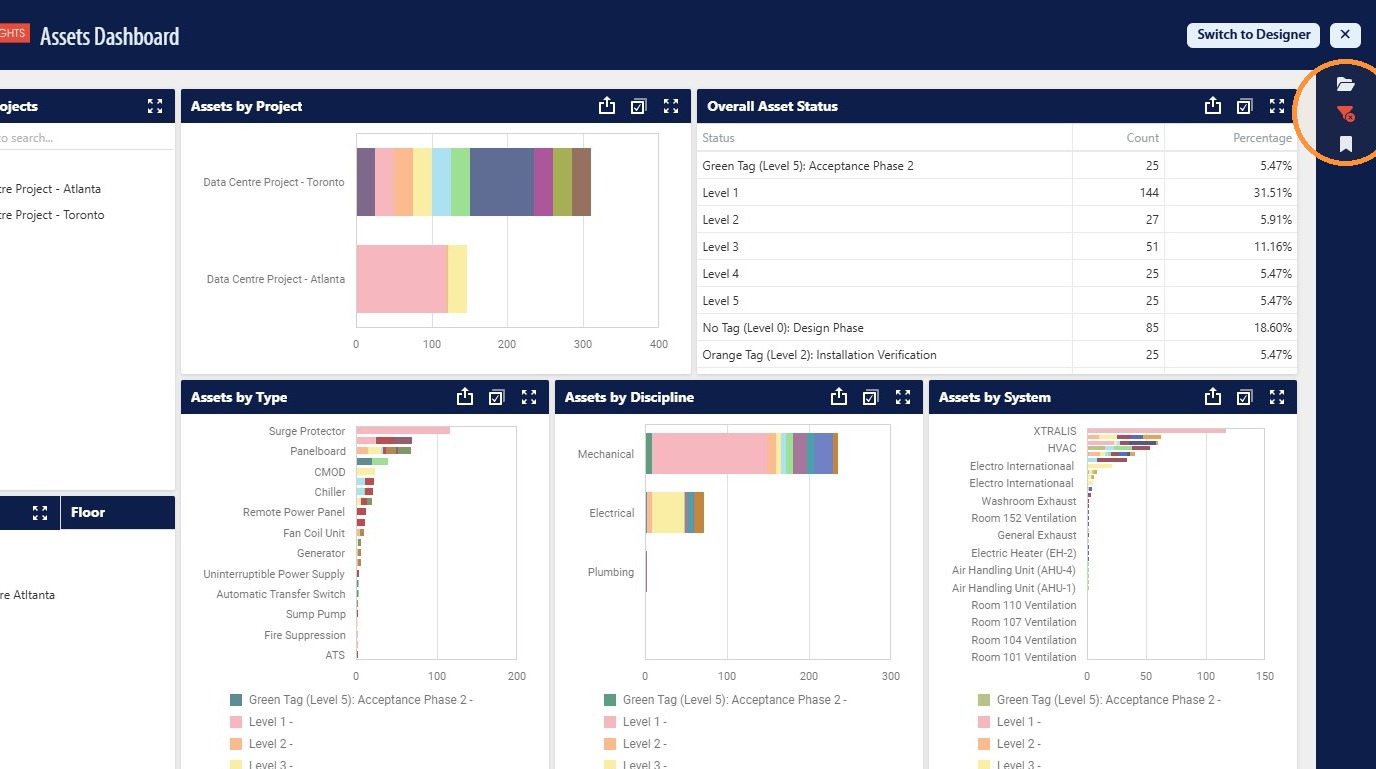
20. A user can clear any filters applied to a dashboard by accessing the filter icon on the Right Hand panel
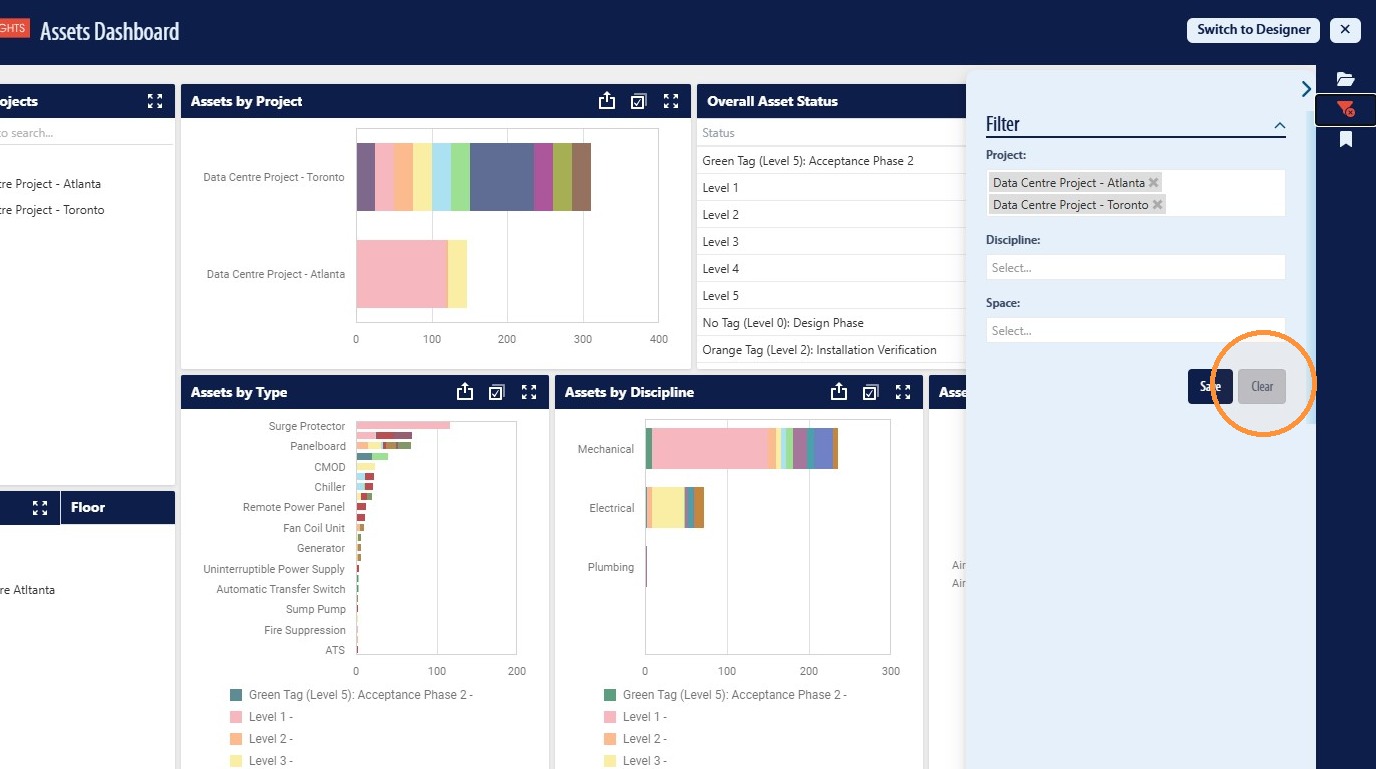
21. From here the user can select the "Clear" option
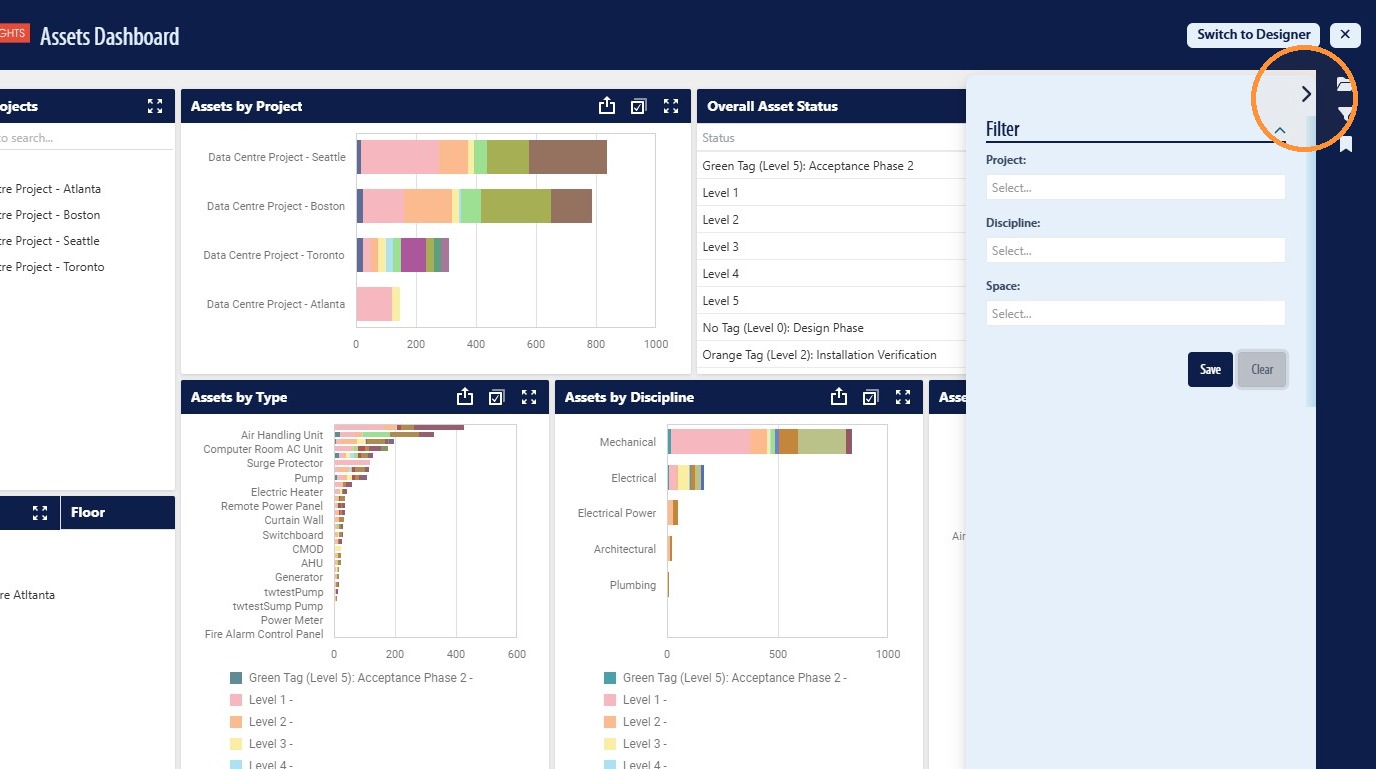
22. Once the dashboard filters have been saved the user should then collape the filter panel to expose the entire dashboard
Close Dashboards
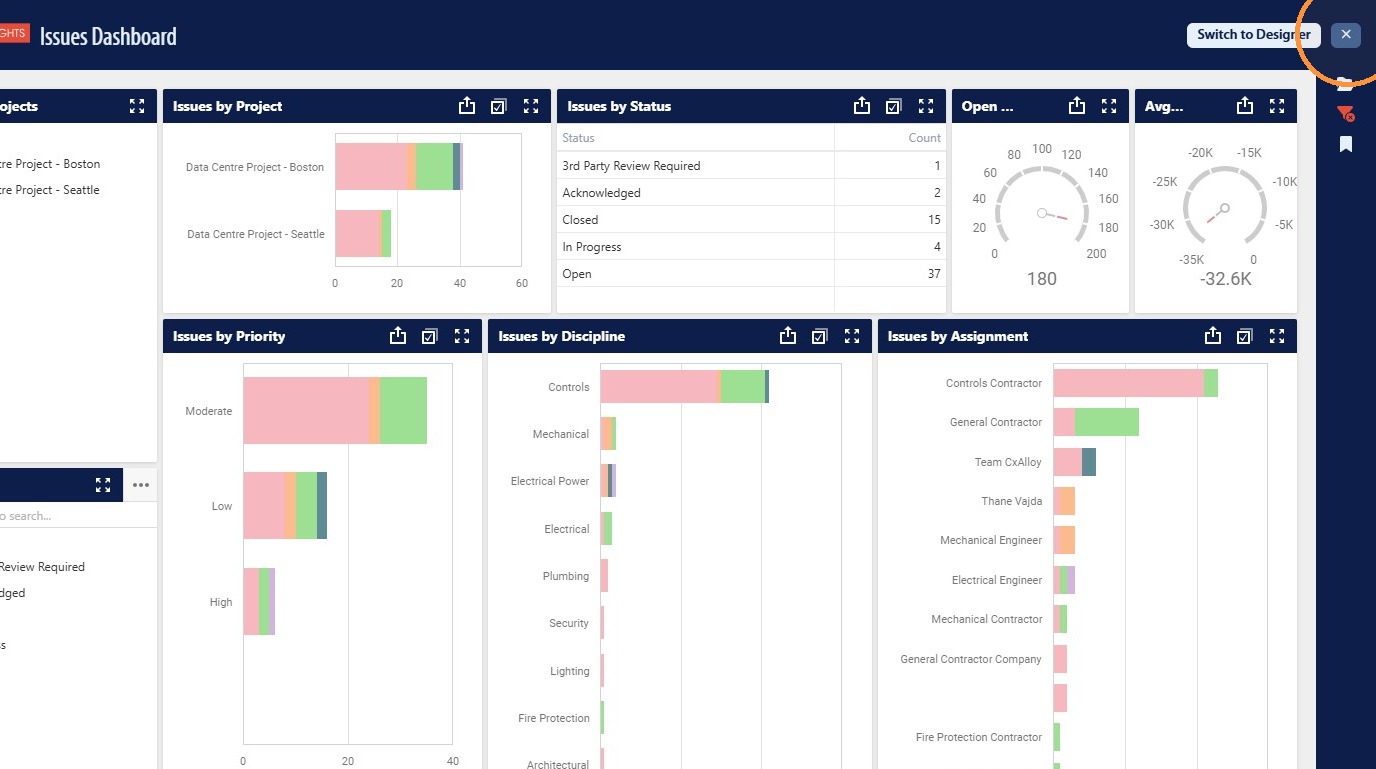
23. To close the dashboard view the user will need to click the "X" icon in the top right
24. A user can return to the Built Insights home page by clicking the Built Insights logo in the Top Left corner